Product Profitability Report
A Product Profitability Report provides a comprehensive analysis of the financial performance of individual products within a company's portfolio. It typically includes data on sales revenue, costs associated with production, marketing, and distribution, as well as profit margins for each product. This report enables businesses to identify their most profitable products, allocate resources effectively, and make informed decisions to optimize their product mix and overall profitability.
- Navigate to Reports > Product Profitability.

- Accrual Profit: The "accrual profit on/off switch" refers to the capability to toggle between accrual accounting and cash-based accounting methods for assessing profitability within a business. This feature allows companies to choose whether to recognize revenue and expenses when they are incurred (accrual basis) or when cash transactions take place (cash basis). By offering this flexibility, businesses can adapt their financial reporting to better suit their needs, regulatory requirements, and strategic objectives.
- Search: sBizzl offers a powerful search feature that allows users to find data quickly and easily by searching using criteria such as product code, product name, or product category
- CSV: A CSV (Comma-Separated Values) file is a useful tool in sBizzl, enabling users to download data in a structured format. Users can export all the data displayed in a list when utilizing this feature.
- Filters: sBizzl empowers you to tailor your data view to your specific needs with its versatile filtering and grouping options:
- Date: The default date filter for this report is typically set to "This Year," allowing users to analyze data within the current calendar year. Users can easily adjust the filter to select from predefined options such as "Last 30 Days," "This Month," "Last Month," "Last Year," or specify a custom date range according to their analytical requirements
- Grouping: The grouping feature empowers users to efficiently organize data by grouping it according to the category name. This capability enhances data organization and facilitates easier analysis,enabling users to gain valuable insights into their data based on distinct product categories.
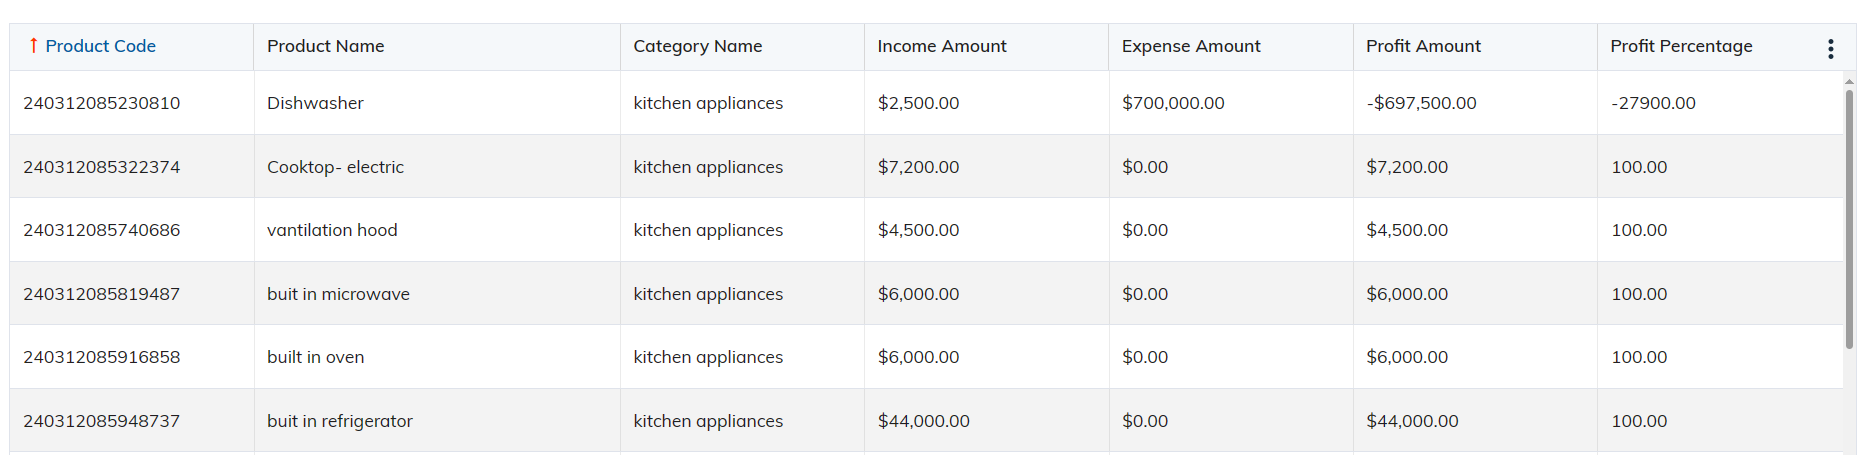
- Product Code: The product code column presents unique codes assigned to each product and includes sorting functionality, allowing users to arrange products numerically or alphabetically based on their codes for easier navigation and analysis of data.
- Product Name: The product name column showcases the names of individual products and incorporates sorting capabilities, enabling users to alphabetically or numerically organize product names for efficient data examination and comparison.
- Category Name: The category name column exhibits the respective categories to which products belong and features sorting functionality, allowing users to arrange products categorically for streamlined data analysis and organization based on product categories.
- Income Amount: The income amount column presents the total revenue generated by each product and includes sorting functionality, enabling users to organize income data in ascending or descending order. This feature facilitates a thorough examination of product-specific revenue streams for informed business analysis and decision-making.
- Expense Amount: The expense Amount column displays the total expenses attributed to each product and provides sorting functionality, allowing users to arrange expense data in ascending or descending order. This feature facilitates a comprehensive analysis of product-related expenditures for effective cost management and decision-making.
- Profit Amount: The profit amount column presents the total profit accrued from each product and offers sorting functionality for organizing profit data in ascending or descending order. This feature facilitates a comprehensive analysis of product profitability, aiding users in making informed decisions regarding resource allocation and business strategies.
- Profit Percentage: The profit percentage column displays the profitability ratio of each product, calculated as the percentage of profit relative to revenue, and includes sorting functionality for arranging profit percentage data in ascending or descending order. This feature enables users to efficiently compare and analyze the profitability of different products within a dataset, aiding in strategic decision-making and performance evaluation.